Every hardware sampler screen and DAW timeline renders audio as a two-dimensional plot of instantaneous voltage (vertical axis) against time (horizontal axis). Knowing what this graph reveals—and what it conceals—prevents clicked edits and over-compressed masters.
Lead Plate WAV-300 // Sample Splicing & Zero-Crossings
Zoom to the Cycle Level Before Slicing
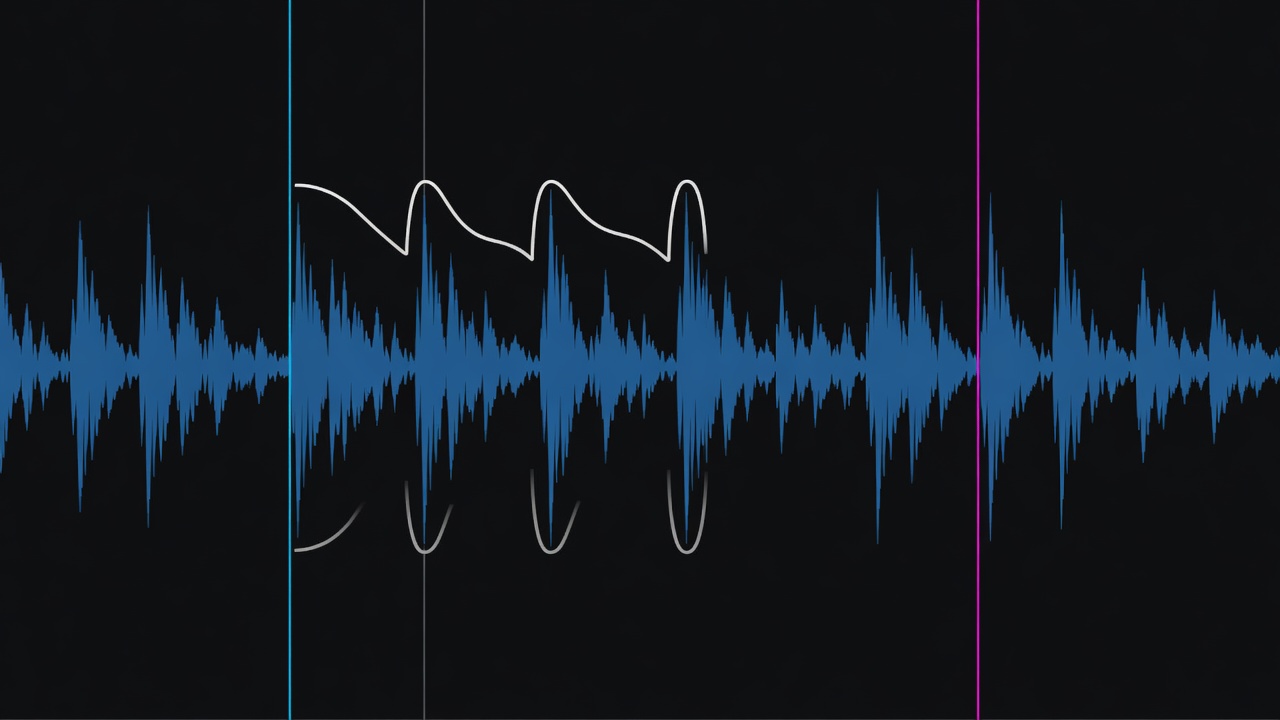
At macro zoom levels, a drum break looks like a sequence of vertical blocks. Zooming down to individual sample points reveals the sinusoidal zero-crossing where voltage passes through 0.0—the only click-free location for an un-faded chop.
Visual Text Equivalent: A high-magnification sample view where individual sample dots are connected by a teal vector line crossing a white horizontal center line. Marker "S" (Start) is locked where the line crosses the center axis travelling upward; Marker "E" (Loop End) is locked 400 cycles later at an identical upward crossing angle.
What the Image Shows vs. What Equipment Can Do
Matching two ascending zero-crossings eliminates an instantaneous voltage step (which would otherwise click). However, on a stereo sample file, the left and right channels rarely cross zero at the exact same microsecond—meaning a stereo chop still requires a 1ms to 3ms micro-fade even when one channel looks aligned on screen.
Visible Geometry
Continuous phase continuity between loop end and loop start
Audible Result
Eliminates high-frequency discontinuity click at the loop wrap point
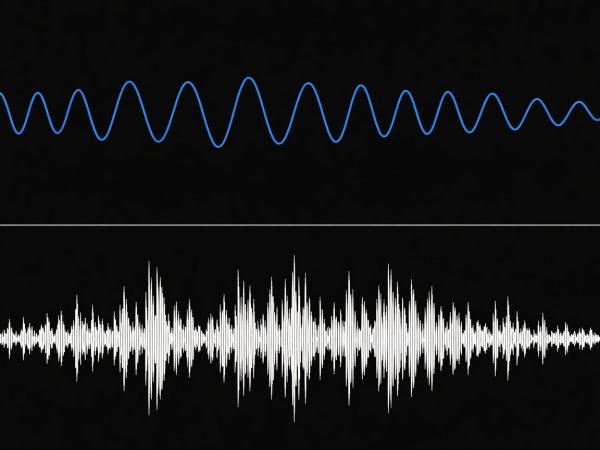
1 Periodic 55Hz Sub Cycles2 Aperiodic High-Frequency Hash
Ref. WAV-314: Periodic Fundamental vs. Aperiodic Noise
Visual Text Equivalent: Two stacked waveform lanes at identical horizontal time scales. The top lane displays wide, smooth, repeating hills spaced 18 milliseconds apart; the bottom lane displays a solid-looking band of tightly packed vertical needles that never repeat a pattern.
Recognition Note: Wide, smooth, repeating waves indicate strong low-frequency pitched fundamentals (such as an 808 kick tail or Rhodes bass note). Dense, furry blocks indicate high-frequency aperiodic noise (cymbals, vinyl crackle, snare wires, or breath air).
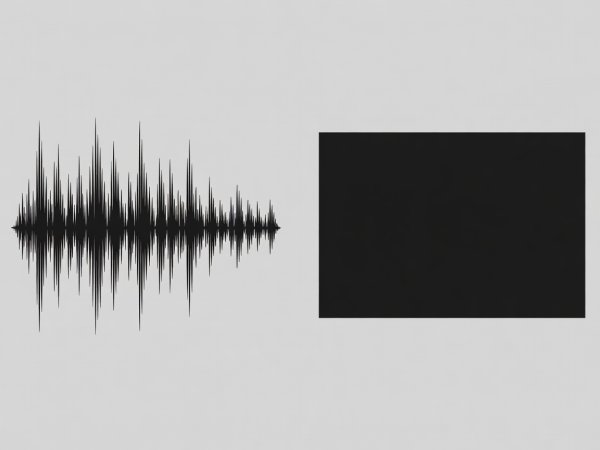
Visual Text Equivalent: On the left, a drum loop shows tall kick and snare spikes towering above quiet ghost notes. On the right, the same loop processed through a look-ahead brickwall limiter forms a dense rectangle where ghost notes and room tail reach nearly the same ceiling as the kick drum.
Recognition Note: While a "sausage" waveform clearly shows reduced peak-to-average ratio (crest factor), you cannot judge whether the limiting sounds transparent or pumping solely from the rectangle—bass-heavy electronic tracks naturally fill the vertical axis even with clean transients.
Left Crest: 14.2 dBRight Crest: 4.1 dB
What a Time-Domain Waveform Can and Cannot Show
Audio Characteristic
Visible in Standard Waveform?
What to Look For / Why It Is Hidden
Transient Attack Timing
Yes (Directly Visible)
Sharp vertical surge from silence or low-level room floor; ideal for placing slice markers and warp transients.
Digital 0dBFS Overload
Yes (At High Zoom)
Consecutive sample points pinned flat against the +/-1.0 ceiling boundary forming horizontal tabletops.
DC Offset
Yes (Directly Visible)
Entire waveform rests above or below the central 0.0 line during silent tails, reducing headroom and causing clicks on edits.
Exact Musical Pitch / Chord Quality
No (Requires Spectrum / FFT)
Polyphonic chords fold multiple frequencies into a single complex wave; you cannot read major vs. minor triads from amplitude shapes.
Reverb Tail vs. Sustained Synth Pad
Ambiguous
Both appear as gradual tapering envelopes; only auditioning or spectral waterfall analysis separates room reflections from dry sustain.